E-Governance
Electronic governance or e-governance is adopted by countries across the world. In a fast-growing and demanding economy like India, e-governance has become essential. The rapid growth of digitalisation has led to many governments across the globe to introduce and incorporate technology into governmental processes. Electronic governance or e-governance can be defined as the usage of Information and Communication Technology (ICT) by the government to provide and facilitate government services, exchange of information, communication transactions and integration of various standalone systems and services.
In other words, it is the use of technology to perform government activities and achieve the objectives of governance. Through e-governance, government services are made available to citizens and businesses in a convenient, efficient and transparent manner. Examples of e-governance include Digital India initiative, National Portal of India, Prime Minister of India portal, Aadhaar, filing and payment of taxes online, digital land management systems, Common Entrance Test etc.
Types of interactions in e-Governance
e-Governance can take place in four major types of interactions, apart from the processes and interactions in the back-office, within the government framework:
Government to Government (G2G)
Information is exchanged within the government i.e., either, between the central government, state government and local governments or between different branches of the same government.
Government to Citizen (G2C)
The citizens have a platform through which they can interact with the government and get access to the variety of public services offered by the Government.
Government to Businesses (G2B)
The businesses are able to interact with the government seamlessly with respect to the services of the government offered to businesses
Government to Employees (G2E)
The interaction between the government and its employees occurs in an efficient and speedy manner.
Objectives of e-Governance
The objectives of e-governance can be listed down as given below:
- To support and simplify governance for government, citizens, and businesses.
- To make government administration more transparent and accountable while addressing the society’s needs and expectations through efficient public services and effective interaction between the people, businesses, and government.
- To reduce corruption in the government.
- To ensure speedy administration of services and information.
- To reduce difficulties for business, provide immediate information and enable digital communication by e-business.
While e-governance provides the advantages of convenience, efficiency and transparency, it also has problems associated with it. They are as follows:
- Lack of computer literacy: India is still a developing country and a vast majority of the citizens lack computer literacy which hinders the effectiveness of e-governance.
- Lack of accessibility to the internet or even computers in some parts of the country is a disadvantage to e-governance.
- e-Governance results in a loss of human interaction. As the system becomes more mechanised, lesser interaction takes place among people.
- It gives rise to the risk of personal data theft and leakage.
e-Governance leads to a lax administration. The service provider can easily provide excuses for not providing the service on technical grounds such as “server is down” or “internet is not working”, etc.
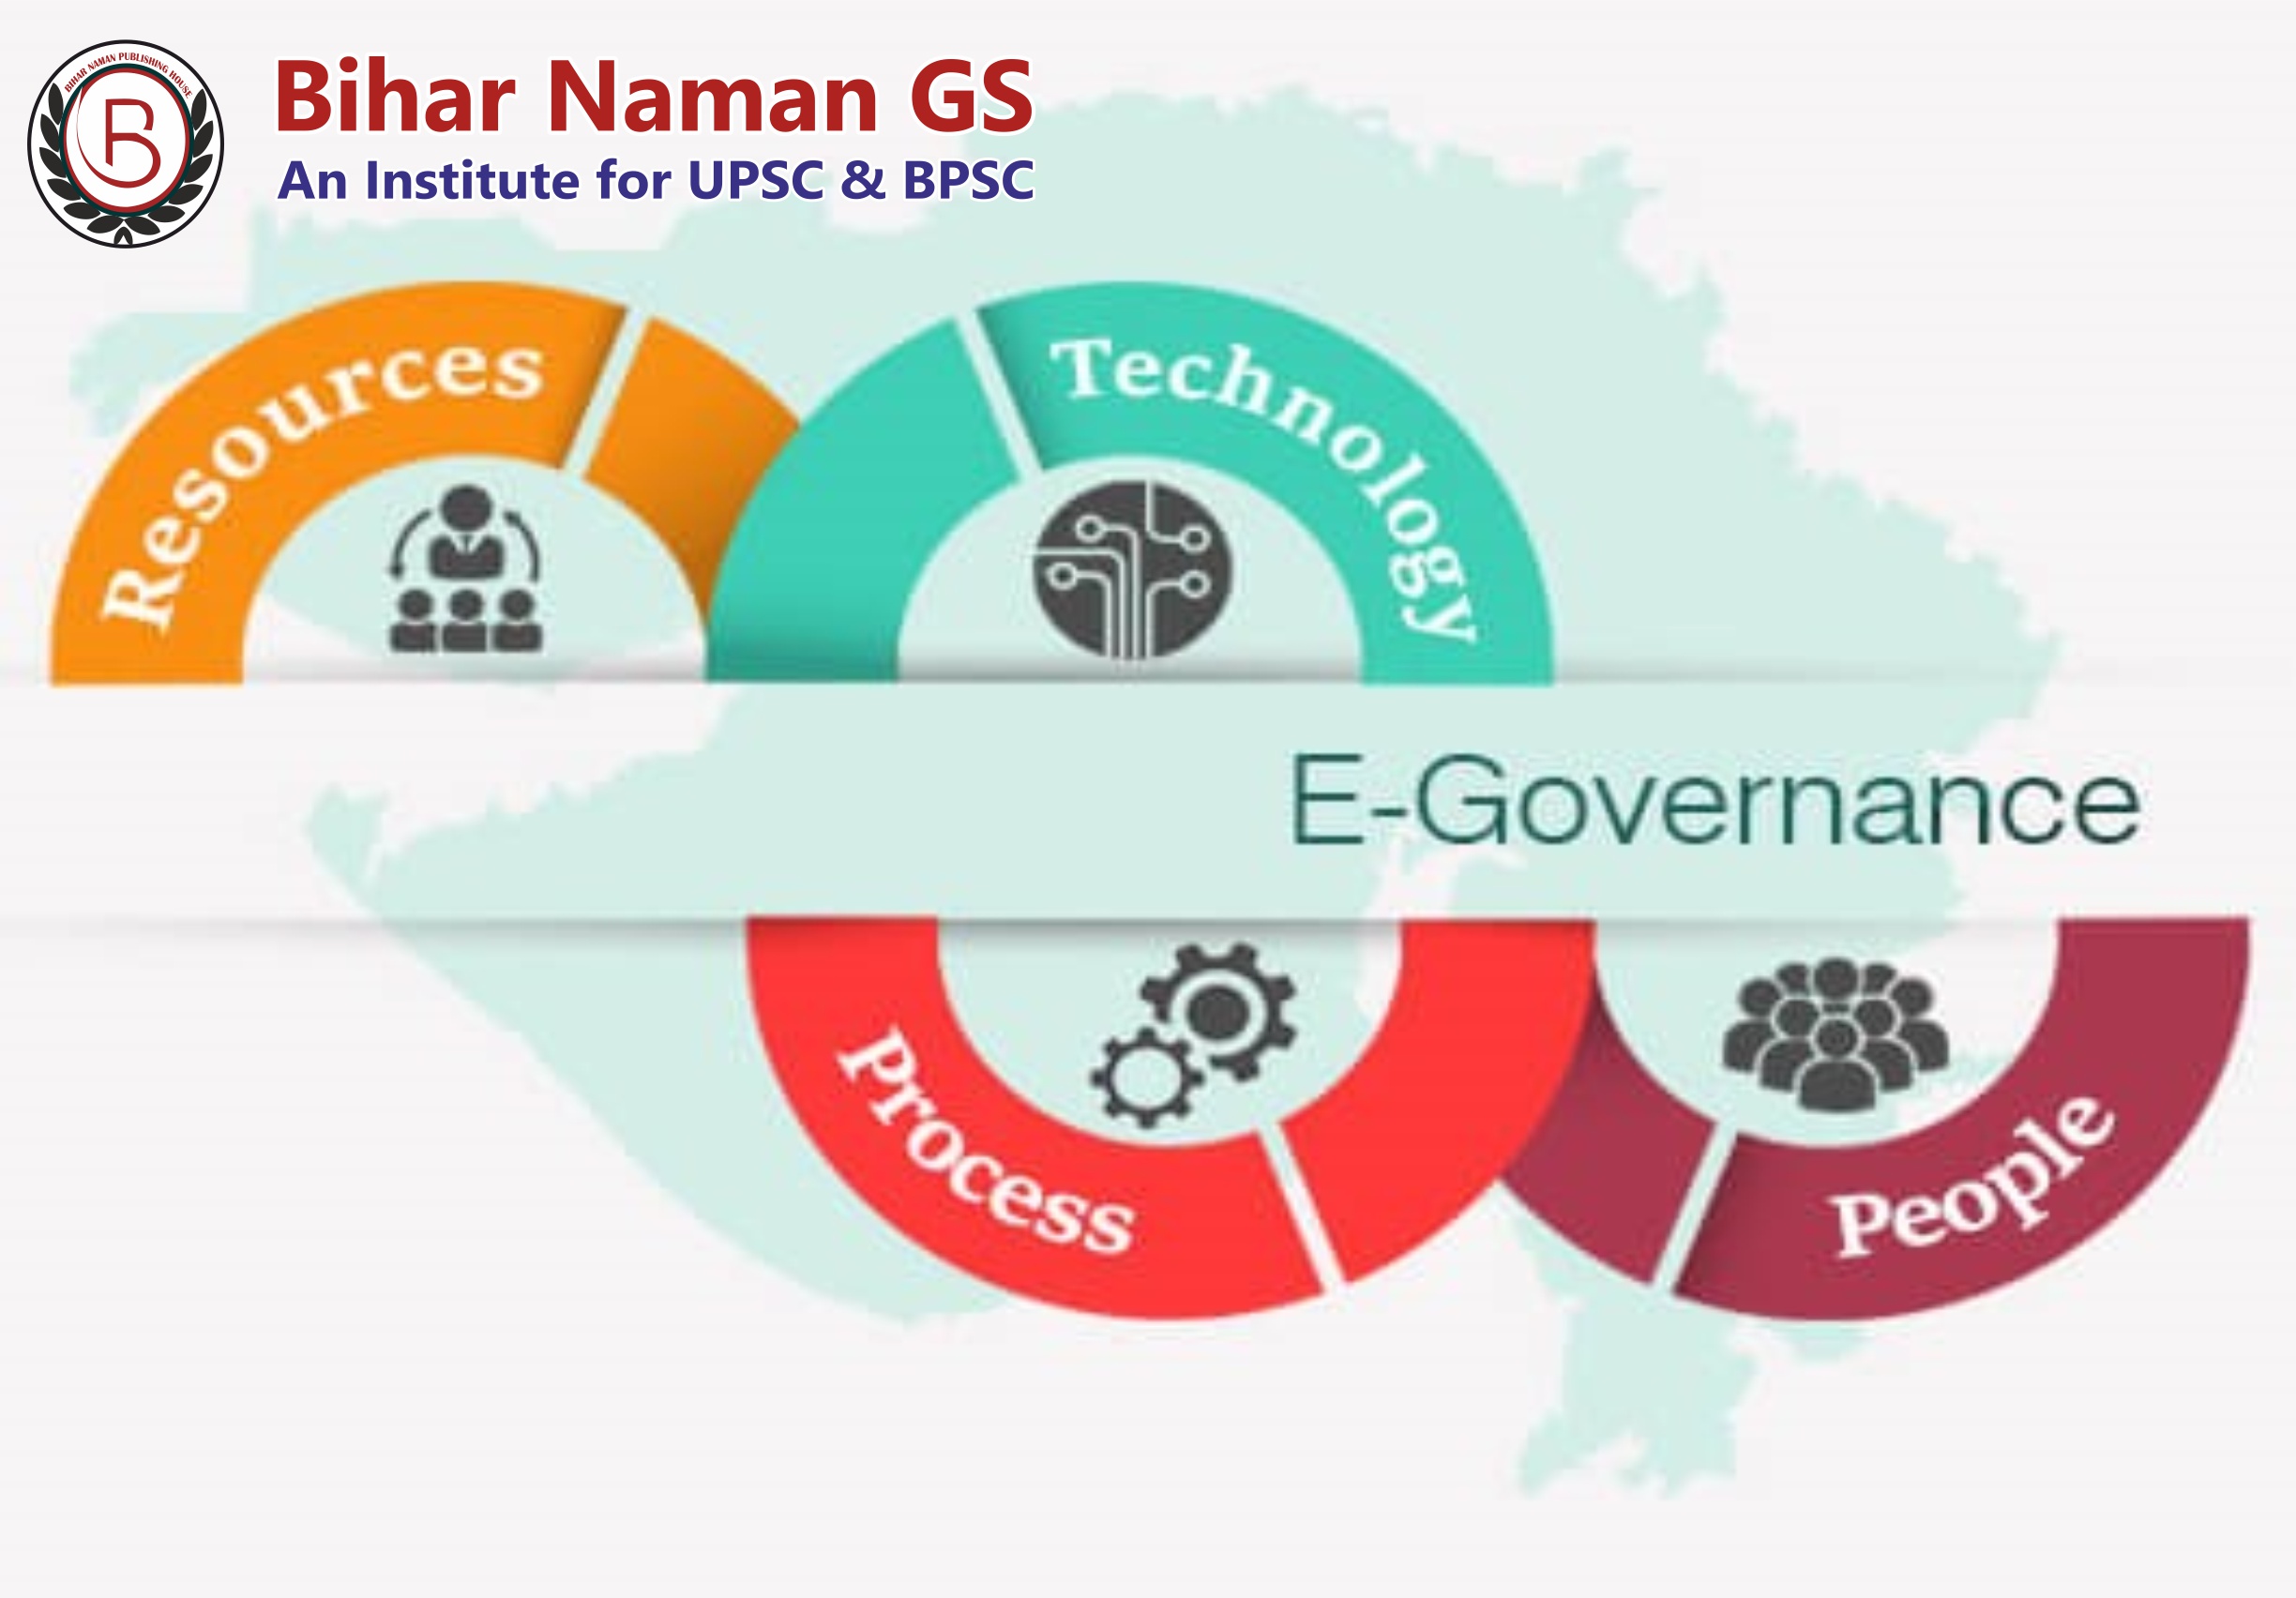
Positive and Negative impact of Caste Census in Bihar
The caste system is arguably the most distinctive feature of Indian society. The Indian population is divided into four hierarchical classes, or varnas, with a large sub-population of untouchables excluded entirely from the system. Within each of these classes, and among the untouchables, are thousands of castes, or jatis. The central rule in Hindu society is that individuals must marry within their own caste. Recent genetic evidence indicates that this rule has been followed for over 2,000 years. Spatial segregation on caste lines within the village results in a high degree of local social connectedness, with caste clusters in distant villages and select urban locations linked to each other through ties of marriage over many generations.
Positive Impact
Caste census can help to identify and address the needs of marginalized and disadvantaged castes. For example, the data from caste census can be used to design policies and programs to improve the access of these castes to education, employment, and healthcare. Caste census can also help to monitor the progress of affirmative action programs and identify any gaps or loopholes. For example, the data from caste census can be used to ensure that the reserved seats in educational institutions and government jobs are being filled by the eligible candidates. Caste census can also provide a comprehensive picture of Bihari society, including its caste dynamics. This data can be used by researchers, policymakers, and civil society organizations to better understand the challenges faced by marginalized and disadvantaged castes and to develop effective interventions to address these challenges.
Negative Impact
Caste census can be divisive, as it could lead to increased social tensions and conflict. For example, the data from caste census could be used by political parties to mobilize voters along caste lines. Caste census can also be counterproductive, as it could reinforce caste identities and hierarchies. For example, the data from caste census could be used by caste groups to assert their dominance over other caste groups. Caste census can also be impractical, as it would be difficult and expensive to conduct a caste census accurately. For example, many people may be reluctant to disclose their caste, especially if they belong to a marginalized or disadvantaged caste.
The way ahead on the issue of caste census is to have a balanced and nuanced approach. It is important to weigh the pros and cons of caste census carefully and to take steps to mitigate the potential negative impacts. One way to do this is to conduct a caste census in a transparent and inclusive manner. All stakeholders, including caste groups, civil society organizations, and academic experts, should be consulted in the design and implementation of the census. Another way to mitigate the negative impacts of caste census is to ensure that the data is used for the right purposes. The data should be used to design and implement policies and programs to promote social justice and equality, and to monitor the progress of affirmative action programs. The data should not be used to mobilize voters along caste lines or to reinforce caste identities and hierarchies.
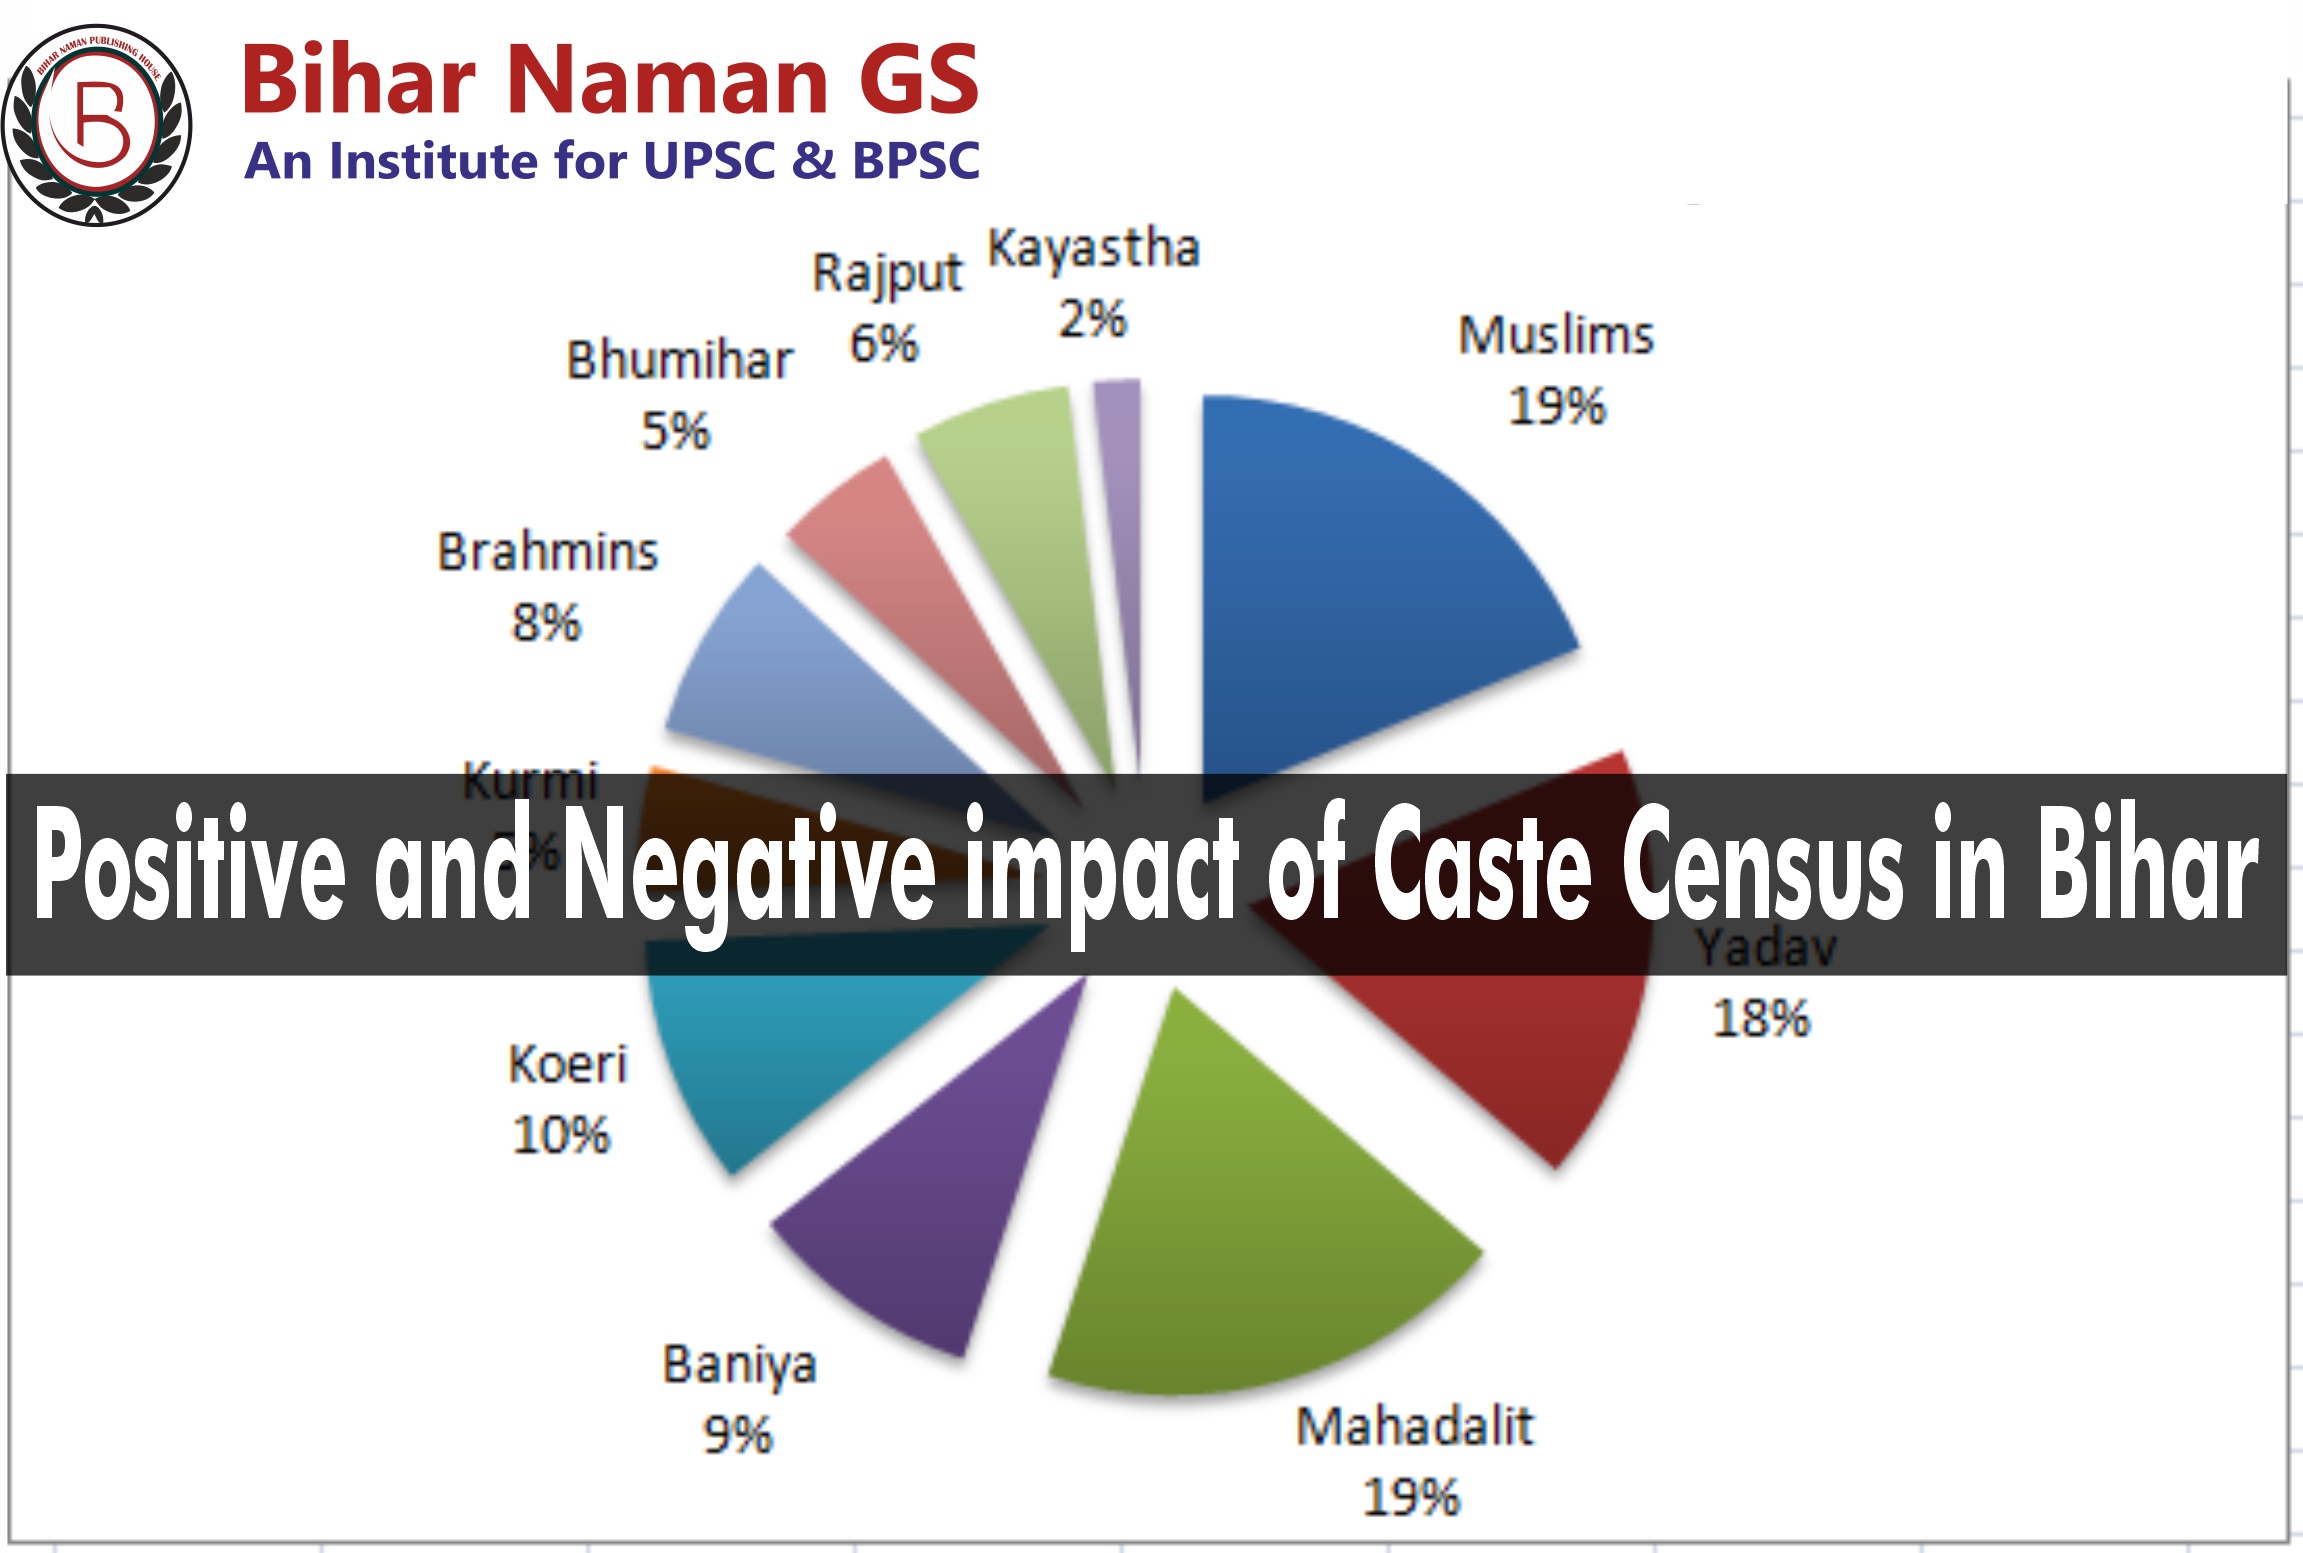
India nominates ‘Maratha Military Landscapes’for 2024-25 UNESCO World Heritage List
Source: PIB
The Ministry of Culture announced that India is nominating the 'Maratha Military Landscape' for inclusion in the UNESCO World Heritage List for the 2024-25 cycle, with a total of 12 components included in this nomination. Suvarnadurg Fort is a part of the historic 'Maratha Military Landscape'.
Details:
- The Maratha Military Landscapes of India, which were built from the 17th to the 19th centuries, are a vivid embodiment of an original system of fortifications and military operations that were derived by the Maratha governors.
- This nomination includes twelve discrete entities, the renowned Hill Forts like Salher, Sivneri Lohagad. Rajgadd, Ginhee forts formulated.
- Also, it encompasses Hill-forest fort of Pratapgad hill fort of Panhala Coastal forts at Vijaydurg and Khanderi islets as Suvarnadurg,.
- These elements spread from various geographical and physiographic regions, together making a statement of the dexterity that Maratha rulers possessed as military men.
Military Landscapes of the Marathas:
In this regard, the military Maratha is a landscape that was set up during the rule of Chhatrapati Shivaji around 1670 CE, and remained dominant in this whole region until 1818. With this military terrain in its background, there were several strategic utilization of the landscape by the Maratha army resulting in its development using some innovative guerrilla warfare methods. The first two successfully worked and were crucial in combating the daunting powers of the Mughal Empire on land and the European coastal navies at sea.
In the history of India’s military acts, there is something positional for Maratha Empire’s strategy and its approach to warfare can be considered as an instructive one which in principle deserves the attention by demonstration all over because it is unique and extraordinary. This recognition has resulted in the nomination of the Maratha military landscape for listing under UNESCO’s prestigious list of World Heritage sites.
The nomination process involves two categories – Cultural and Natural criteria – which highlight the historical and strategic significance of the Maratha military landscape. The Maratha Military Landscapes in India are classified under the cultural criteria category for potential inclusion in the World Heritage List. In order to be considered for this prestigious list, cultural sites must meet six criteria (i to vi), while natural sites must fulfil four criteria (vii to x). The Maratha Military Landscapes of India have been put forward for nomination based on three distinct cultural criteria.
- The first criterion emphasises their ability to provide a remarkable and unparalleled testament to a cultural tradition or civilization, whether that culture is still thriving or has become extinct.
- The second criterion highlights their status as an exceptional representation of a particular kind of structure, architectural or technological ensemble, or landscape that showcases important milestones in human history.
- Lastly, the third criterion recognizes their direct or tangible connection to events, living traditions, ideas, beliefs, or artistic and literary works that hold exceptional universal significance.
About United Nations Educational, Scientific and Cultural Organization (UNESCO):
UNESCO is a specialized agency of the United Nations that was established in 1945 and is headquartered in Paris. Its main goal is to promote peace and security through international collaboration in the areas of education, science, and culture. It has 194 member states and India is one of its founding members. India’s several sites that have been recognized by UNESCO. India has a total of 42 UNESCO World Heritage Sites, with 34 being Cultural sites, 7 being Natural sites, and 2 being mixed sites. Recently, Shantiniketan and the temples of Belur, Halebid, and Somananthpura were added to the World Heritage list, bringing India’s total to 42.
Poverty in Bihar
70th BPSC GS Paper - 2 , Sec. - II | Bihar Economy
By : Tarun Ranjan (Circle Officer, Govt. of Bihar)
Poverty: Poverty is the deprivation of food, shelter, money and clothing when people can’t satisfy their basic needs. Poverty can be understood simply as a lack of money or morebroadly in terms of barriers to everyday human life. Gandhi says poverty is the worst form of violence. Providing minimum basic needs to the people upliftment of the poorest of the poor (Antyodaya), integrating the poor into the mainstream and achieving a minimum standard of living for all have been the major aims of independent India. World Bank’s document Poverty and Shared Prosperity notes that since growth in the world economy is slowing down, this would have a deleterious effect on poverty reduction. For achieving a given target of poverty reduction therefore, such as what the Sustainable Development Goals (SDG-1) of the UN specify, namely ending poverty (almost) by 2030, income inequality should be reduced. Towards this end, the objective is to increase the share of the bottom 40 percent of the population in total income.
Measures of Poverty-
(1) Absolute Poverty: (Destitution) It refers to the state of severe deprivation of basic human needs.
(2) Relative Poverty: It is defined contextually as Economic inequality in location or society in which people live.
WHAT CAUSES POVERTY?
The causes of poverty lie in the institutional and social factors that mark the life of the poor. The poor are deprived of quality education and unable to acquire skills which fetch better incomes. Also access to health care is denied to the poor. The main victims of caste, religious and other discriminatory practices are poor. These can be caused as a result of -
- social, economic and political inequality
- social exclusion
- unemployment
- indebtedness
- Unequal distribution of wealth. Aggregate poverty is just the sum of individual poverty.
Poverty is also explained by general, economy-wide problems, such as-
- low capital formation
- lack of infrastructure
- lack of demand
- pressure of population
- lack of social/ welfare nets.
Poverty Line
Poverty Line refers to the minimum income, consumption, or, more generally access to goods and services below which individuals are considered to be poor. The poverty line in India is the expenditure level at which a minimum calorie intake and indispensable non-food purchases are assured. It may be noted that even among the poor, there are differences in the degrees of poverty. So the focus of the government policies should be on the poorest of the poor. Nutrition based poverty lines are used in many countries. Due to various limitations in the official estimation of poverty, scholars have attempted to find alternative methods. For instance, Amartya Sen, noted Nobel Laureate, has developed an index known as Sen Index. There are other tools such as Poverty Gap Index and Squared Poverty Gap.
There are many factors, other than income and assets, which are associated with poverty; for instance, the accessibility to basic education, health care, drinking water and sanitation. They need to be considered to develop Poverty Line. The existing mechanism for determining the Poverty Line also does not take into consideration social factors that trigger and perpetuate poverty such as illiteracy, ill health, lack of access to resources, discrimination or lack of civil and political freedoms.
Why defining poverty line is a controversial issue?
Most of the governments have mothballed the reports of commmittees and panels because this issue is not only politically sensitive but also has deeper fiscal ramifications. If the poverty threshhold is high, it may leave out many needed people; while if it is low, then it would be bad for fiscal health of the government. Third, there is a lack of consensus among states too. We note that some states such as Odisha and West Bengal supported the Tendulkar Poverty Line while others such as Delhi, Jharkhand, Mizoram etc. supported Rangrajan Line. Thus, no one, including NITI aayog wants to bell the cat when it comes to count number of poor in the country.
How poverty is measured in other countries?
In most of European countries, a family with net income of less than 60% of a median net disposable income is counted as poor. In United States, poverty line represents the basic cost of food for a family multiplied by three. A family is counted as poor if its pre-tax income is below this threshold.
Poverty in India
A large section of the rural poor in India are the small farmers. The land that they have is, in general, less fertile and dependent on monsoon. Their survival depends on subsistence crops and sometimes on livestock. With the rapid growth of population and without alternative sources of employment, the per-head availability of land for cultivation has steadily declined leading to fragmentation of land holdings. The income from these small land holdings is not sufficient to meet the family’s basic requirements and to pay back the loans that they have taken for cultivation and other domestic needs. In situations of drought and other natural calamities make them take extreme steps like suicide. A large section of urban poor in India are largely the overflow of the rural poor who migrate to urban areas in search of employment and a livelihood. Industrialisation has not been able to absorb all these people. The urban poor are either unemployed or intermittently employed as casual labourers. Casual labourers are among the most vulnerable in society as they have no job security, no assets, limited skills, sparse opportunities and no surplus to sustain them. Poverty is, therefore, also closely related to nature of employment. Unemployment or under employment and the casual and intermittent nature of work in both rural and urban areas that compels indebtedness, in turn, reinforces poverty. Indebtedness is one of the significant factors of poverty. A steep rise in the price of foodgrains and other essential goods, at a rate higher than the price of luxury goods, further intensifies the hardship and deprivation of lower income groups. The unequal distribution of income and assets has also led to the persistence of poverty in India. All this has created two distinct groups in society: those who posses the means of production and earn good incomes and those who have only their labour to trade for survival. Over the years, the gap between the rich and the poor in India has widened. Poverty is a multi-dimensional challenge for India that needs to be addressed on a war footing.
Poverty Measurement efforts undertaken in India
India is home to over one-third of poor people in the world. If we add the poor of Pakistan and Bangladesh into it, we find that almost half of world poverty exists in just these three nations. The next big concentration of poverty is in the sub-Saharan Africa. However, estimation of poverty has been a contentious issue in India. Historically, first estimation of a poverty line was done by Dadabhai Naoroji in 19th century, though he himself did not use the word “poverty line”.
1. Dadabhai Naoroji
The history of poverty estimation in India goes back to 19th century when Dadabhai Naoroji’s efforts and careful study led him to conclude subsistence based poverty line at 1867-68 prices, though he never used the word “poverty line”. It was based on the cost of a subsistence diet consisting of ‘rice or flour, dal, mutton, vegetables, ghee, vegetable oil and salt’. According to him, subsistence was what is necessary for the bare wants of a human being, to keep him in ordinary good health and decency. His studies included the scale of diet and he came to a conclusion on the subsistence costs based poverty line that varied from Rs.16 to Rs.35 per capita per year in various regions of India.
2. National Planning Committee
In 1938, Congress president Subhash Chandra Bose set up the National Planning Committee (NPC) with Jawaharlal Nehru as chairman and Professor K. T. Shah as secretary for the purpose of drawing up an economic plan with the fundamental aim to ensure an adequate standard of living for the masses. The Committee regarded the irreducible minimum income between Rs. 15 to Rs. 25 per capita per month at Pre-war prices. However, this was also not tagged something as a poverty line of the country. First Planning Commission working group, the concept of the poverty line was first introduced by a working group of the Planning Commission in 1962 and subsequently expanded in 1979 by a task force. The 1962 working group recommended that the national minimum for each household of five persons should be not less than Rs 100 per month for rural and Rs. 125 for urban at 1960-61 prices. These estimates excluded the expenditure on health and education, which both were expected to be provided by the state.
3. Y K Alagh Committee
Till 1979, the approach to estimate poverty was traditional i.e. lack of income. It was later decided to measure poverty precisely as starvation i.e. in terms of how much people eat. This approach was first of all adopted by the YK Alagh Committee’s recommendation in 1979 whereby, the people consuming less than 2100 calories in the urban areas or less than 2400 calories in the rural areas are poor. The logic behind the discrimination between rural and urban areas was that the rural people do more physical work. Moreover, an implicit assumption was that the states would take care of the health and education of the people. Thus, YK Alagh eventually defined the first poverty line in India.
4. Lakdawala Formula
Till as recently as 2011, the official poverty lines were based entirely on the recommendations of the Lakdawala Committee of 1993. This poverty line was set such that anyone above them would be able to afford 2400 and 2100 calories worth of consumption in rural and urban areas respectively in addition to clothing and shelter. These calorie consumptions were derived from YK Alagh committee only. According to the Lakdawala Committee, a poor is one who cannot meet these average energy requirements. However, Lakdawala formula was different in the following respects in comparison to the previous models:
- In the earlier estimates, both health and education were excluded because they were expected to be provided by the states.
- This committee defined poverty line on the basis of household per capita consumption expenditure. The committee used CPI-IL (Consumer Price Index for Industrial Laborers) and CPI- AL (Consumer Price Index for Agricultural Laborers) for estimation of the poverty line.
- The method of calculating poverty included first estimating the per capita household expenditure at which the average energy norm is met, and then, with that expenditure as the poverty line, defining as poor as all persons who live in households with per capita expenditures below the estimated value. The fallout of the Lakdawala formula was that number of people below the poverty line got almost double. The number of people below the poverty line was 16 per cent of the population in 1993-94. Under the Lakdawala calculation, it became 36.3 per cent.
5. Suresh Tendulkar Committee
In 2005, Suresh Tendulkar committee was constituted by the Planning Commission. The current estimations of poverty are based upon the recommendations of this committee. This committee recommended to shift away from the calorie based model and made the poverty line somewhat broad based by considering monthly spending on education, health, electricity and transport also.
- It strongly recommended target nutritional outcomes i.e. instead of calories; intake nutrition support should be counted.
- It suggested that a uniform Poverty Basket Line be used for rural and urban region. It recommended a change in the way prices are adjusted and demanded for an explicit provision in the Poverty Basket Line to account for private expenditure in health and education.
- Tendulkar adopted the cost of living as the basis for identifying poverty. The Tendulkar panel stipulated a benchmark daily per capita expenditure of Rs. 27 and Rs. 33 in rural and urban areas, respectively, and arrived at a cut-off of about 22% of the population below poverty line. However, this amount was such low that it immediately faced a backlash from all section of media and society. Since the numbers were unrealistic and too low, the government appointed another committee under Prime Minister’s Economic Advisory Council Chairman C. Rangarajan to review the poverty estimation methodology. Brushing aside the Tendulkar Committee. Rangarajan committee raised these limits to Rs. 32 and Rs. 47, respectively, and worked out poverty line at close to 30%. With estimates of Rangarajan committee, Poverty stood at around 30% in 2011-12. The number of poor in India was estimated at 36.3 crore in 2011- 12.
6. Current Status: Arvind Panagariya Task Force
The discussion about Lakdawala Formula, Suresh Tendulkar Committee and Rangarajan Committee make it clear that defining a poverty line in India has been a controversial issue since 1970s. The latest poverty line defined was by Rangarajan Formula. However, this report also did not assuage the critics. The new NDA Government turned down this report also. To define the poverty line, The NDA Government had constituted a 14-member task force under NITI Aayog’s vice-chairman Arvind Panagariya to come out with recommendations for a realistic poverty line. After one and half years work, this task force also failed to reach a consensus on poverty line. In September 2016, it suggested to the government that another panel of specialists should be asked to do this job {if defining poverty line}. Informally, this committee supported the poverty line as suggested by Tendulkar Committee.
There are Various measures of the extent of poverty
1. The head count index: It simply measures the proportion of the population that is counted as poor. Most widely used maesurement tool for poverty estimation.
Head count index = Number of Poor /Total Number of Population Weakness
1. It does not take the intensity of poverty into account.
2. Survey does not indicate how poor the poor are, and hence does not change if people below the poverty line become poorer.
3. The poverty estimates should be calculated for individuals and not the households. Significance
1. The most common method of measuring and reporting poverty is the headcount ratio, given as the percentage of population that is below the poverty line.
2. One of the undesirable features of the headcount ratio is that it ignores the depth of poverty; if the poor becomes poorer, the headcount index does not change.
2. The poverty gap index: It is a measure of the intensity of poverty. It is defined as the average poverty gap in the population as a proportion of the poverty line. Poverty gap index provides a clearer perspective on the depth of poverty by estimating the depth of poverty by considering how far, on the average, the poor are from that poverty line and is an improvement over the poverty measure headcount ratio which simply counts all the people below a poverty line, in a given population, and considers them equally poor. By definition, poverty gap index is a percentage between 0 and 100%. Sometimes it is reported as a fraction, between 0 and 1. A theoretical value of zero implies that all the extremely poor people are exactly at the poverty line. A theoretical value of 100% implies all the extremely poor people have zero income.
3. The squared poverty gap (poverty severity) index: It is related to poverty gap index. It is calculated by averaging the square of poverty gap ratio. By squaring each poverty gap data, the measure puts more weight the further a poor person's observed income falls below the poverty line. The squared poverty gap index is one form of a weighted sum of poverty gaps, with the weight proportionate to the poverty gap.
4. Sen index is related to poverty gap index (PGI). Appraisal of Government measures From 2014, a scheme called Pradhan Mantri Jan-Dhan Yojana is available in which people in India are encouraged to open bank accounts. Besides promoting savings habit, this scheme intends to transfer all the benefits of government schemes and subsidies to account holders directly. Each bank account holder is also entitled to Rs. 2 lakh accident insurance and Rs. 30,000 life insurance cover.
Poverty alleviation programs in India
India has been conducting various poverty alleviation programs. Employment programmes and skill-building.
Jawahar Gram Samriddhi Yojana: The JRY was meant to generate meaningful employment opportunities for the unemployed and underemployed in rural areas through the creation of economic infrastructure and community and social assets.
Mahatma Gandhi National Rural Employment Guarantee Act (MGNREGA) 2005: The Act provides 100 days assured employment every year to every rural household. One-third of the proposed jobs would be reserved for women. Under the programme, if an applicant is not provided employment within 15 days s/he will be entitled to a daily unemployment allowance.
National Rural Livelihood Mission: Ajeevika (2011): It evolves out the need to diversify the needs of the rural poor and provide them jobs with regular income on monthly basis. Self Help Groups are formed at the village level to help the needy.
National Urban Livelihood Mission: The NULM focuses on organizing urban poor in Self Help Groups, creating opportunities for skill development leading to market-based employment and helping them to set up self-employment ventures by ensuring easy access to credit.
Pradhan Mantri Kaushal Vikas Yojana: It will focus on the fresh entrant to the labour market, especially the labour market and class X and XII dropouts.
Food and shelter
Food for Work Programme: It aims at enhancing food security through wage employment. Foodgrains are supplied to states free of cost, however, the supply of food grains from the Food Corporation of India (FCI) godowns has been slow.
Annapurna: This scheme was started by the government in 1999–2000 to provide food to senior citizens who cannot take care of themselves and are not under the National Old Age Pension Scheme (NOAPS). This scheme would provide 10 kg of free food grains a month for the eligible senior citizens. They mostly target groups of ‘poorest of the poor’ and ‘indigent senior citizens’.
Pradhan Mantri Awaas Yojana: It has two components: Pradhan Mantri Awaas Yojana (Grameen) and Pradhan Mantri Awaas Yojana (Urban). It was launched in 2015. It unites schemes like Ujjwala yojana (provides LPG to BPL), access to toilets, water, drinking water facilities and Saubhagya Yojana (electricity).
Other schemes like Integrated Child Development Program, Midday Meal scheme etc are also providing food to the needy sections like children and women.
Access to credit
Pradhan Mantri Kisan Samman Nidhi: This scheme aims to provide financial assistance to provide working capital support to all the landholding farmers. This brings in the idea of universal basic income for the farmers in India.
Pradhan Mantri Jan Dhan Yojana: It aimed at direct benefit transfer of subsidy, pension, insurance etc. and attained the target of opening 1.5 crore bank accounts. The scheme particularly targets the unbanked poor.
Integrated Rural Development Programme (IRDP): It was introduced in 1978-79 aimed at providing assistance to the rural poor in the form of subsidy and bank credit for productive employment opportunities through successive plan periods.
Challenges
- Incidence of extreme poverty continues to be much higher in rural areas than in urban areas.
- Despite rapid growth and development, an unacceptably high proportion of our population continues to suffer from severe and multidimensional deprivation.
- While a large number of poverty alleviation programmes have been initiated, they function in silos. There is no systematic attempt to identify people who are in poverty, determine their needs, address them and enable them to move above the poverty line.
- The resources allocated to anti-poverty programmes are inadequate and there is a tacit understanding that targets will be curtailed according to fund availability. For instance, Mahatma Gandhi National Rural Employment Guarantee Act does not provide the guaranteed 100 days of work in many states.
- There is no method to ensure that programmes reach everybody they are meant for.
- Lack of proper implementation and right targeting
- There has been a lot of overlapping of schemes.
- Every year a huge number is added to the population pool of the country. This renders the scheme ineffective.
Way Forward
The World Health Organization has described poverty as the greatest cause of suffering on earth. Poverty eradication should not be the goal of the government but the goal of the government policies should be to create prosperity. Both monetary and non-monetary measures of poverty are needed to better inform the policies intended to address the needs and deprivations faced by poor populations.
Accelerating rural poverty reduction:
It’s not just about agricultural growth, which has long been considered the key driver of poverty reduction. Rural India is not predominantly agricultural and shares many of the economic conditions of smaller urban areas.
Capitalizing on the growing connectivity between rural and urban areas, and between the agriculture, industry and services sectors, has been effective in the past.
Creating more and better jobs
Future efforts will need to address job creation in more productive sectors, which has until now been lukewarm and has yielded few salaried jobs that offer stability and security.
Focusing on women and Scheduled Tribes
The most worrying trends are the low participation of women in the labour market and the slow progress among scheduled tribes.
India’s women have been withdrawing from the labour force since 2005and less than one-third of working-age women are now in the labour force. As a result, India today ranks last among BRICS countries, and close to the bottom in South Asia in female labour force participation.
Scheduled Tribes started with the highest poverty rates of all of India’s social groups, and have progressed more slowly than the rest.
Women and Scheduled Tribes are at risk of being locked out of India’s growth and prosperity.
Improving human development outcomes for the poor
The recent past shows that some problems, such as undernutrition and open defecation, are endemic and not only confined to the poor but others too, and have not improved with economic growth.
Better health, sanitation and education will not only help raise the productivity of millions, they will also empower the people to meet their aspirations, and provide the country with new drivers of economic growth.
Together with mooting the discussion on the need to provide a universal basic income, infrastructural and skill development combined with effective implementation of welfare policies will go a long way in eradicating poverty in the country.
How to reduce poverty in Bihar?
- Bihar’s turnaround under the leadership of Nitish Kumar – from a badly governed, economically backward state, to the fastest growing state in India – has received widespread attention. This turnaround story assumes greater significance because Bihar’s economic decline and divergence from rest of the India had been an extremely long and continuous process, rarely reversed by major economic and political changes that transformed many other states of India. The permanent settlement regime imposed by the colonial government sowed the seeds of Bihar’s decline, and continues to hinder its development even now (see Banerjee & Iyer 2005). Even after the independence, the central government adopted several discriminatory policies such as freight equalisation, which led to the further economic marginalisation of Bihar. Successive state governments in Bihar also contributed to its economic decline by plundering public resources and ignoring the state’s developmental needs.
- Bihar’s average economic growth since 2005, when the current government came to power, has been more than 11 per cent, which is often termed a ‘miracle’ considering the extremely low level of economic growth under previous regimes. This spectacular economic progress has, however, recently been questioned for its negligible impact on poverty reduction (Acharya, 2013).
- According to National Sample Survey (NSS) data, the percentage of people living below the poverty line (BPL) was 54.5 per cent in 2004-05, which reduced only marginally to 53.5 per cent in 2009-10. This is surprising as many states with lower economic growth saw much higher poverty reduction during this period. While many commentators use this evidence to jump to the conclusion that Bihar has pursued a growth model that benefitted only the rich, a closer look at the data suggest that it would be a mistake to take the poverty figures of 2009-10 seriously. This is mainly because 2009 was not a ‘normal’ year as Bihar (and many other states) faced severe drought that resulted in 11 per cent reduction in agricultural output, which in turn lowered the income level of around 76 per cent of households that are dependent on agriculture and allied activities for their livelihood.
- Poverty estimates based on the 2011-12 round of NSS data, recently released by the Planning Commission of India, is consistent with this hypothesis. It shows that percentage of BPL population in Bihar is only 33.74 per cent, which means a massive 20 percentage point reduction within two years. This is incredibly high and can be true only if 2009-10 was an outlier year.
- Let’s therefore disregard the estimates of 2009-10 and compare the estimates of 2004-5 with 2011-12 for further analysis. How do we rate Bihar’s 20-percentage-point reduction in poverty over a period of seven years, when Bihar’s average growth rate during that time was almost 10 per cent? On ranking 20 bigger states of India in terms of total poverty reduction during this period, we find that Orissa tops the list with 24 percentage points, followed by Maharashtra, Bihar, Andhra Pradesh and Rajasthan, all of which report an approximately 20 percentage points’ reduction in the poverty ratio. The good news is that Bihar is in the top three states in terms of total poverty reduction, which dispels the myth that Bihar’s growth had little impact on poverty reduction.
- However, Bihar’s performance is not as impressive as its growth rate: many other states with lower rates of economic growth managed similar reductions in the poverty level. Clearly, Bihar needs to make its economic growth more pro-poor.
- Given the fact that two thirds of Bihar’s population is dependent on agriculture, boosting agricultural growth is likely to be the most effective way of enhancing the poverty-reducing effects of economic growth. The government of Bihar has prepared a long-term roadmap for agriculture that attempts to address some of the challenges, but it seems that the biggest constraint to agricultural growth in the state is the government’s inability to implement land reforms. West Bengal, Bihar’s neighbouring state, which was also under the permanent settlement regime under the colonial government and faced similar problems in the agriculture sector, managed to implement land reforms in late 1970s that have had a major impact on agricultural growth for decades (Banerjee et al 2002).
- The Government of Bihar did set up a land reforms commission in 2006 but has not been able to implement its recommendations due to strong opposition from the upper castes who continue to wield immense political power. Admittedly, it might not be politically feasible for the current government to take up radical land reforms measures such as land redistribution. But it is possible to strategically implement some of the less sensitive land reforms on a priority basis: updating land records, tenancy registration, and better enforcement of tenants’ interests. Even these second best reforms, as Besley & Burgess (1999) have shown, are associated with significant poverty reduction. The tenancy reforms lead to poverty reduction through various channels. First, increased tenurial security leads to higher investment in land, which raises long-term productivity and the income level of the cultivators. Second, tenancy registration allow the sharecroppers/tenants to avail benefits of several government programmes that are generally available only for owner cultivators. Third, these reforms also result in higher agricultural wages, which improves the welfare of landless households.
- Bihar’s economic growth, which was more than 14 per cent in the last financial year, continues to defy the recessionary forces that India is facing. However, the extent to which this spectacular growth translates into poverty reduction depends on the government’s ability to remove binding constraints for agricultural growth.
70th BPSC Mains Practice Question
1. According to NITI Aayog, 'Multidimensional Poverty' is high in Bihar. Explain the factors responsible for it. Which of the latest schemes being implemented by the government to overcome poverty in Bihar?
Agriculture challenges of Bihar
70th BPSC GS Paper - 2 , Sec. - II | Bihar Economy
By : Alok Rajput (Block Supply Officer, Govt. of Bihar)
“Bihar is located in the eastern part of India. The state is surrounded by Nepal in the north, West Bengal in the east, Uttar Pradesh in the west, and Jharkhand in the south. The state enjoys a unique location specific advantage because of its proximity to the vast markets of eastern and northern India, access to ports such as Kolkata and Haldia, and to raw material sources and mineral reserves from the neighboring states.
The Gross State Domestic Product (GSDP) of Bihar grew at a CAGR of 13.27% between 2015-16 and 2019-20. Bihar has witnessed strong growth in per capita net state domestic product. At current prices, per capita NSDP of the state grew at a CAGR of 13.41% (in Rs.) between 2016 and 2021.
Bihar is one of the strongest agricultural states. The percentage of population employed in agricultural production in Bihar is around 80%, which is much higher than the national average. It is the fourth largest producer of vegetables and the eight largest producers of fruits in India. Food processing, dairy, sugar, manufacturing, and healthcare are some of the fast-growing industries in the state. The state has planned initiatives for the development of other sectors such as education and tourism and also provides incentives for information technology and renewable energy.”
Bihar is considered destination for second Green Revolution in the country. Several reports including the National Farmers Commission have emphasized the need for accelerated development of agriculture in eastern India for securing food security of the country. Dr. A.P.J. Abdul Kalam, the then President of India has described Agriculture as Core Competence of Bihar.
In Bihar agriculture and allied sector contributes 18.9 percent of the GSDP. Farm holdings are small and scattered. There are about 1.61 crore farm holdings of which 91 percent is marginal. The water area of Bihar constitutes about 3.9 percent of the total geographical area. Bihar is a major fruit and vegetable growing state.
Agriculture is the mainstay of Bihar’s economy. According to the census of 2011, about 74% of the workforce in Bihar depend directly or indirectly on agriculture and allied activities for their subsistence. Around 88.7% of the population of Bihar resides in the rural areas therefore agriculture sector plays a vital role in the overall growth of the state’s economy.
In 2021-22, the contribution of the agricultural sector to Bihar’s Gross State Value Addition (GSVA) stands around 26%. The agriculture of Bihar helps in generating employment opportunities, poverty alleviation, and improving livelihood. Due to the bifurcation of Bihar in 2000, the bulk of mineral resources are currently in Jharkhand. Consequently, agriculture is the only sector that has maximum potential in Bihar.
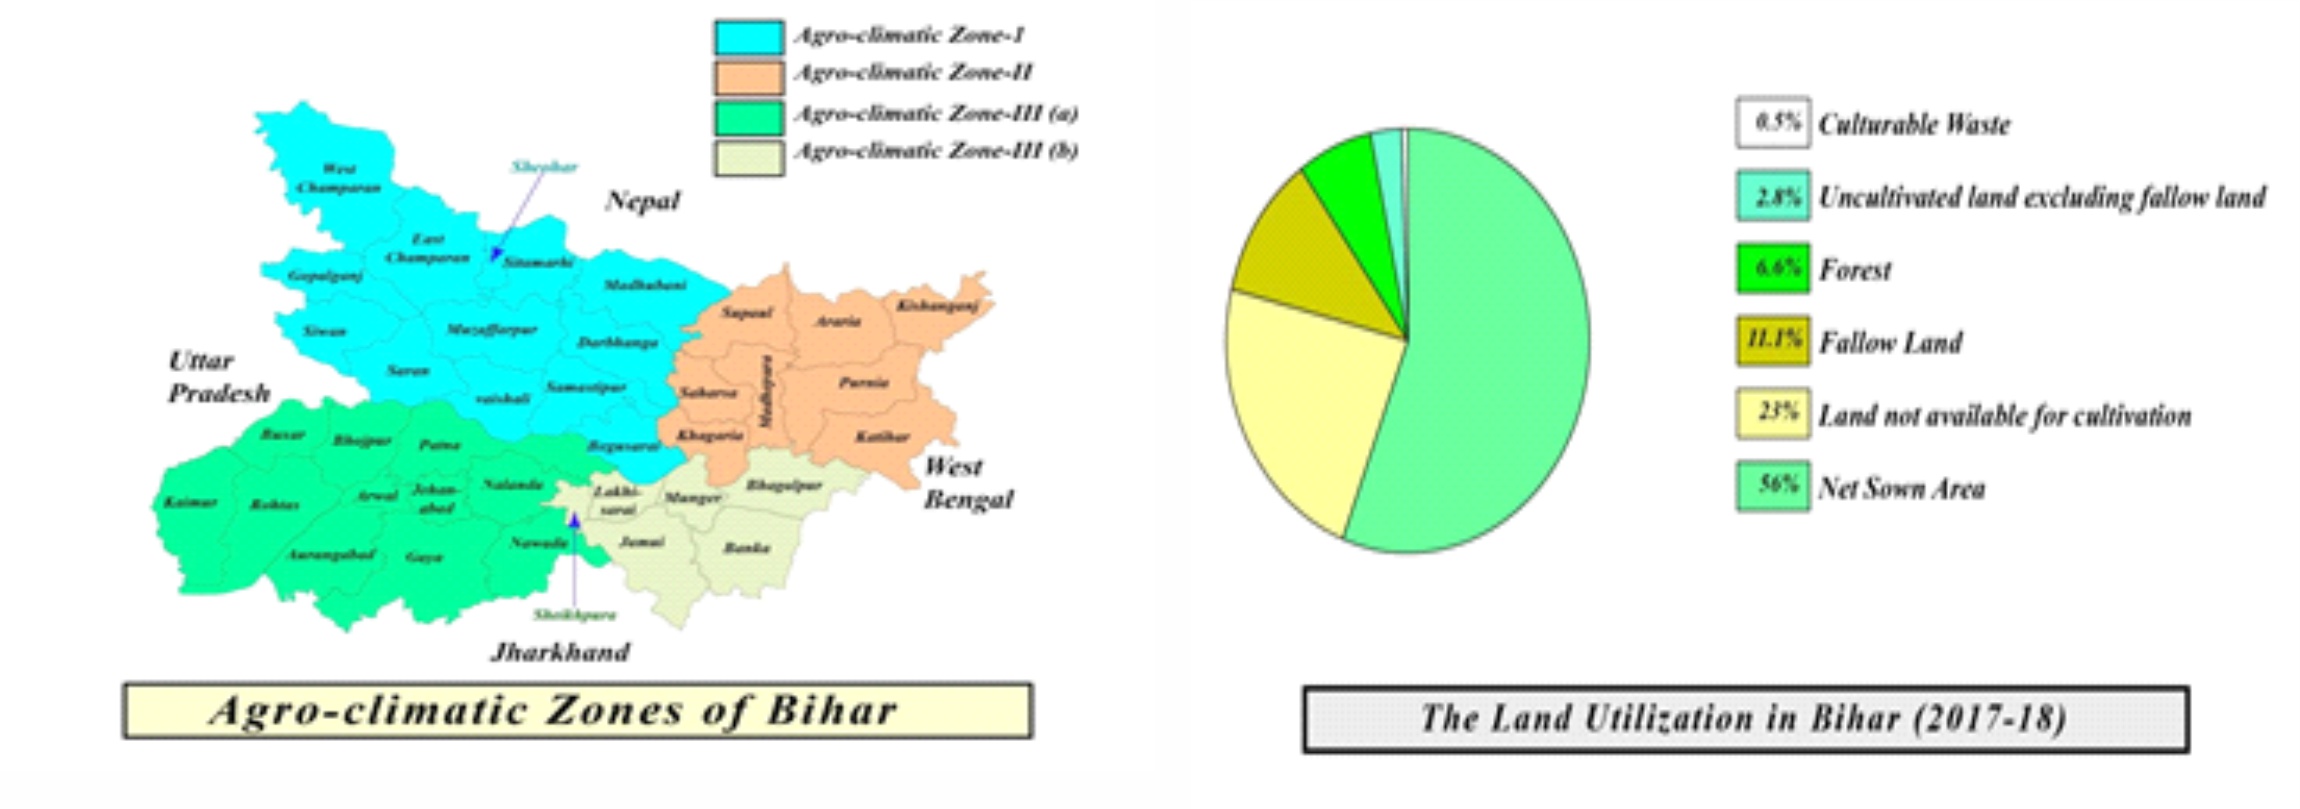
Agro-climatic zones in Bihar
Based on the profile of soil, rainfall, temperature, and topography, there are four agro-climatic zones in Bihar. These agro-climatic zones are as following types-
- Zone-1 : North-West alluvial plain.
- Zone-2 : North-East alluvial plain.
- Zone-3 (a) : South-East alluvial plain.
- Zone-3 (b) : South-West alluvial plain.
Out of four agro-climatic zones of Bihar, the zone-1 & 2 are located on the north of Ganga river. On the other hand, zone-3 is entirely located in the south of Ganga. However, the floods in Bihar cause huge loss to the northern agro-climatic zone i.e. zone-1 & 2.
In terms of precipitation, zone-3 receives the lowest rainfall while the agro-climatic zone-1 and 2 receive moderate and high rainfall respectively. However, the rainfall during the monsoon is highest in zone-2 (1105.9mm).
Agro-climatic zone-1
Topographically, the zone-1 slopes towards the south-east direction, having alluvial plains with a very low gradient. The Saran, Vaishali and Samastipur situated in this zone are water-logged. The western portion of this zone is under the influence of the Adhwara System of rivers. For instance, Gandak, Burhi Gandak and Ghaghra. Geologically, this zone has calcareous nodules. The following are the six broad soil association groups of this zone.
- Sub-Himalayan and forest soil
- Recent alluvial Tarai soil
- Young Alluvial calcareous soil
- Young alluvial calcareous saline soil
- Young alluvial non-calcareous, non-saline soil
- Recent alluvial calcareous soil
Agro-climatic zone-2
This agro-climatic zone is marked by alluvial plains formed by the sediments carried by the rivers namely Kosi, Ganga, Mahananda and its tributaries. Also, this region is marked by floods, caused by the Kosi river. Topographically, the general slope of the plains is toward the south-east.
Unlike agro-climatic zone-1, the soil of this zone is non-calcareous but rich in acidic minerals. The salinity and alkalinity are more in Saharsa, western parts of Purnia and Katihar district. The following are the three broad soil association groups of this zone.
Agro-climatic zone-3
The plains of this zone have alluvial and red & yellow soils formed by the river Ganga and those flowing from the south, having their origins in the Chhotanagpur plateau. This zone-3 is marked by backwater known as Tal lands extending from Buxar to Bhagalpur. Locally, the Tal lands are known as Diara lands. The following are the broad soil association groups in this zone.
- The recent alluvial calcareous soil.
- Tal land soil, light grey, dark grey medium to heavy textured soil.
- Old alluvial reddish yellow, yellowish-grey centenary soil.
- Old alluvial grey, greyish-yellow, heavy texture soil with cracking nature.
- The recent alluvial yellowish to reddish-yellow non-calcareous non-saline soils.
- Old alluvial yellowish to red-yellow soil of foothills.
- Old alluvial saline and saline-alkali soils.
- Land use pattern at the district level
The district such as Kaimur, Jamui, West Champaran, Gaya, Rohtas, and Nawada together accounted for a total of 5.06 lakh hectare of forest area, more than 80% of the total forest area in Bihar.
The agriculture of Bihar faces multifaceted challenges. The following are the major factors contributing to low productivity in Bihar.
Major challenges to the agriculture of Bihar
Uneven Monsoon: Although the water resources of Bihar are abundant and it receives 999mm of average rainfall. However, the variation in the onset of monsoon on year to year basis results in flood and the drought-like situation in Bihar simultaneously.
Wastage of water: The current method of flood irrigation in Bihar results in about 35% loss of water. About 60% of the water diverted or pumped for irrigation is wasted via runoff, evapotranspiration, percolation and seepage.
Technological factors: Technological factors: There are two agricultural universities, five agricultural colleges,one horticulture college,one agriculture engineering college,one dairy technology college and one veterinary college in the state. All the 38 distrcts have a functional Krishi Vigyan Kendra (KVK).ICAR has also a presence with eastern states regional headquarter at Patna. Besides, National Research Centre for Litchi and Makhana are established in state. However,State productivity remains low because of the slow adoption of modern technologies by the farmers. Dominance of cereals in cropping pattern reflect on the subsistence nature of state agriculture. Institutional extension system faces the challenge to take latest technologies to farmers field.Small size of lands. The size of landholding is very small in Bihar that compels the small cultivators to resort to the subsidiary occupation. More than 90% of all land-holding fall in the category of marginal holding with a farm size less than 1 hectare.
Declining investment in agriculture: Due to high risk and uncertainty in the agro-climatic zones, prices, productivity, etc, the financing in the farm sector become a problem. The slow pace implementation of Kisan Credit Cards leaves the small farmers to highly dependent on non-institutional credit sources. The moneylenders demand exorbitant interest rate and farmers get trapped in huge debt cycles.
Weeds: Weeds directly deplete the soil nutrients and moisture thus reducing the crop yield.
Seed related issues: Due to exorbitant prices of seeds, a majority of farmers, especially small and marginal farmers are deprived of good quality seeds. Due to the stable price of urea and increase the price of Potash and Phosphorous farmers use more urea than Potash and Phosphorous.
Inadequate marketing and processing: Due to inadequate food processing units and marketing facilities, farmers compel to sell their crops at low prices.
Floods and Droughts: Bihar experience both floods and droughts simultaneously. Click this to read a complete article on floods in Bihar.
Land Issues: More than 91 percent of all holdings fall in the category of marginal holdings with farm size less than 1 hectare. Each such holding is again fragmented in small parcels. Land records are obsolete, making any institutional investment virtually impossible. Small farm agriculture creates serious problems for economy of scale.
Rainfed agriculture: State agriculture still heavily depends on monsoon. In the last 5 years, there has been drought or drought like situation in four consecutive years. Kharif crops are almost a gamble leaving little prospect for investments in costly inputs. Canal Irrigation is scanty. Irrigation is majorly (70%) dependent on diesel based tube wells. High cost of diesel based irrigation make it a very difficult input for even rabi crops.
Lack of Infrastructure: Road connectivity, storage godown and power availability to agriculture sector is inadequate to usher accelerated agriculture development in the state.
Lack of institutional credit: slow pace of implementation of kisan credit card leave large number of farmers dependent on high cost non institutional lending sources seriously impeding use of modern agri inputs and adoption of modern technology.
Soil is the topmost layer of the continental crust having weathered particles of rocks. The soils of India are the product of physical factors as well as human factors.
Soil can be simply defined as a mixture of small rock particles/debris and organic materials/ humus which develop on the earth’s surface and support the growth of plants.
Factors that influence soil formation–
- Parent Material
- Relief/Topography
- Climate
- Natural Vegetation & Biological factors
- Time
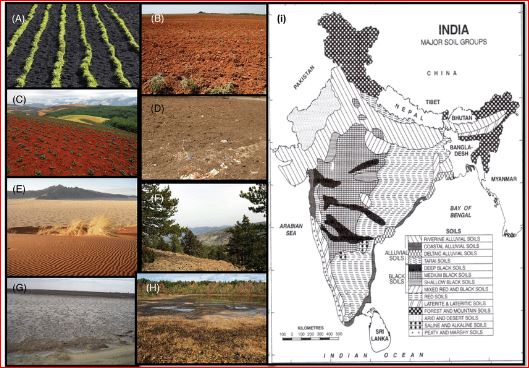
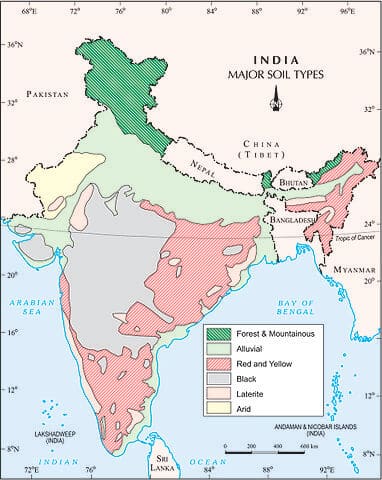
Soil types in India (Types of Soil)
The first scientific classification of soil was done by Vasily Dokuchaev. In India, the Indian Council of Agricultural Research (ICAR) has classified soils into 8 categories.
- Alluvial Soil
- Black Cotton Soil
- Red Soil
- Laterite Soil
- Mountainous or Forest Soils
- Arid or Desert Soil
- Saline and Alkaline Soil
- Peaty, and Marshy Soil/Bog Soil
This classification scheme is based on constitutional characteristics – colour and the resource significance of the soils.
The ICAR has also classified the Indian soils on the basis of their nature and character as per the United States Department of Agriculture (USDA) Soil Taxonomy.
- Inceptisols (39.74%)
- Entisols
- Alfisols
- Vertisols
- Aridisols
- Ultisols
- Mollisols
- Others
Alluvial Soils
- Alluvial soils are formed mainly due to silt deposited by Indo-Gangetic-Brahmaputra rivers. In coastal regions, some alluvial deposits are formed due to wave action.
- Rocks of the Himalayas form the parent material. Thus the parent material of these soils is of transported origin.
- They are the largest soil group covering about 15 lakh sq km or about 46 percent of the total area.
- They support more than 40% of India’s population by providing the most productive agricultural lands.
Characteristics of Alluvial Soils
- They are immature and have weak profiles due to their recent origin.
- Most of the soil is sandy and clayey soils are not uncommon.
- They vary from loamy to sandy-loam in drier regions and clayey loam towards the delta.
- Pebbly and gravelly soils are rare. Kankar (calcareous concretions) beds are present in some regions along the river terraces.
- The soil is porous because of its loamy (equal proportion of sand and clay) nature.
- Porosity and texture provide good drainage and other conditions favorable for agriculture.
- These soils are constantly replenished by the recurrent floods.
Chemical properties of Alluvial Soils
- The proportion of nitrogen is generally low.
- The proportion of Potash, phosphoric acid, and alkalies are adequate
- The proportion of Iron oxide and lime vary within a wide range.
Distribution of Alluvial Soils in India
- They occur all along the Indo-Gangetic-Brahmaputra plains except in few places where the top layer is covered by desert sand.
- They also occur in deltas of the Mahanadi, the Godavari, the Krishna, and the Cauvery, where they are called deltaic alluvium (coastal alluvium)
- Some alluvial soils are found in the Narmada, Tapi valleys, and Northern parts of Gujarat.
Crops in Alluvial Soils
- They are mostly flat and regular soils and are best suited for agriculture.
- They are best suited to irrigation and respond well to the canal and well/tube-well irrigation.
- They yield splendid crops of rice, wheat, sugarcane, tobacco, cotton, jute, maize, oilseeds, vegetables, and fruits.
Geological divisions of alluvial soils
- Geologically, the alluvium of the Great plain of India is divided into newer or younger khadar and older bhangar soils.
Bhabar
- The bhabar belt is about 8-16 km wide running along the Shiwalik foothills. It is a porous, northern most stretch of Indo-Gangetic plain.
- Rivers descending from the Himalayas deposit their load along the foothills in the form of alluvial fans. These alluvial fans (often pebbly soils) have merged together to build up the bhabar belt.
- The porosity of bhabar is the most unique feature. The porosity is due to deposition of huge number of pebbles and rock debris across the alluvial fans.
- The streams disappear once they reach the bhabar region because of this porosity. Therefore, the area is marked by dry river courses except in the rainy season.
- The area is not suitable for agriculture and only big trees with large roots thrive in this belt.
Terai
- Terai is an ill-drained, damp (marshy) and thickly forested narrow tract (15-30 km wide) to the south of Bhabar running parallel to it.
- The underground streams of the Bhabar belt re-emerge in this belt. It is a swampy lowland with silty soils.
- The terai soils are rich in nitrogen and organic matter but are deficient in phosphate.
- These soils are generally covered by tall grasses and forests but are suitable for a number of crops such as wheat, rice, sugarcane, jute, etc.
- This thickly forested region provides shelter to a variety of wildlife.
Bhangar
- The Bhangar is the older alluvium along the river beds forming terraces higher than the flood plain (about 30 meters above the flood level).
- It is of a more clayey composition and is generally dark-colored.
- A few meters below the terrace of the bhangar are beds of lime nodules known as “Kankar”.
Khadar
- The Khadar is composed of newer alluvium and forms the flood plains along the river banks.
- The banks are flooded almost every year and a new layer of alluvium is deposited with every flood. This makes them the most fertile soils of the Ganges.
- They are sandy clays and loams, drier and leached, less calcareous and carbonaceous (less kankary). A new layer of alluvium is deposited by river floods almost every year.
Alluvial regions with rainfall
- Above 100cm – Suitable for paddy
- B/w 50-100cm – Suitable for wheat, sugarcane, tobacco, and cotton
- Below 50cm– Course grains (millets)
Black Soils
- Formation –formed due to weathering of these basaltic rocks which emerged during fissure eruption of the Cretaceous period.
- The parent material for most of the black soil are the volcanic rocks that were formed in the Deccan Plateau (Deccan and the Rajmahal trap).
- In Tamil Nadu, gneisses and schists form the parent material. The former are sufficiently deep while the later are generally shallow.
- These are the region of high temperature and low rainfall. It is, therefore, a soil group typical to the dry and hot regions of the Peninsula.
- Extent – 15 % of the area
- Black colour is ordained by titani-ferrous magnetic compounds found in basalt.
Characteristics of Black Soils
- A typical black soil is highly argillaceous [Geology (of rocks or sediment) consisting of or containing clay] with a large clay factor, 62 percent or more.
- In general, black soils of uplands are of low fertility while those in the valleys are very fertile.
- The black soil is highly retentive of moisture. It swells greatly on accumulating moisture. Strenuous effort is required to work on such soil in rainy season as it gets very sticky.
- In summer, the moisture evaporates the soil shrinks and is seamed with broad and deep cracks. The lower layers can still retain moisture. The cracks permits oxygenation of the soil to sufficient depths and the soil has extraordinary fertility.
- When dry, it develops cracks and has blocky structure. (Self Ploughing Capacity)
Colour of Black Soils
- The black colour is due to the presence of a small proportion of titaniferous magnetite or iron and black constituents of the parent rock.
- In Tamil Nadu and parts of Andhra Pradesh, the black colour is derived from crystalline schists and basic gneisses.
- Various tints of the black colour such as deep black, medium black, shallow black , a mixture of red and black may be found in this group of soils.
Chemical Composition of Black Soils
- 10 percent of alumina,
- 9-10 percent of iron oxide,
- 6-8 percent of lime and magnesium carbonates,
- Potash is variable (less than 0.5 percent) and
- phosphates, nitrogen, and humus are low.
Rich in iron and lime but deficient in humus, nitrogenous and phosphorous content.
Distribution of Black Soils
- It is found in the Deccan lava plateau region of India.
- Spread over 46 lakh sq km (16.6 percent of the total area) across Maharashtra, Madhya Pradesh, parts of Karnataka, Telangana, Andhra Pradesh, Gujarat, and Tamil Nadu.
Crops in Black Soils
- These soils are best suited for cotton crops. Hence these soils are called as regur and black cotton soils.
- Other major crops grown on the black soils include wheat, jowar, linseed, virginia tobacco, castor, sunflower, and millets.
- Rice and sugarcane are equally important where irrigation facilities are available.
- Large varieties of vegetables and fruits are also successfully grown on the black soils.
- This soil has been used for growing a variety of crops for centuries without adding fertilizers and manures, with little or no evidence of exhaustion.
Red Soil
- This soil developed on Archean granite occupies the second largest area of the country.
- The presence of ferric oxides makes the colour of soil red, ferric oxides occurring as thin coatings on the soil particles.
- The top layer of the soil is red and the horizon below is yellowish.
- Extent – 18.5 % of the area
- Texture: Sandy to clay and loamy.
- This soil is also known as the omnibus group.
Characteristics of Red Soils
- Rainfall is highly variable. Thus, the soil has developed 3 subtypes
- Red & Yellow soil – rainfall is 200cm – NE India – Nagaland, Mizoram, Manipur Hills, parts of Malabar coast, quick drainage is needed
- Red Sandy Soil – Drier plateaus like Karnataka, TN, Telangana, Rayalseema – rainfall from 40-60cm
- RedAlluvial Soil – Along river valleys – has good fertility
- Well drained soil and structure is sandy
- Rich in iron and potash but deficient in other minerals.
Chemical Composition of Red Soils
Generally, these soils are deficient in phosphate, lime, magnesia, humus and nitrogen.
Distribution of Red Soils
They are mainly found in the Peninsula from Tamil Nadu in the south to Bundelkhand in the north and Raj Mahal in the east to Kathiawad in the west.
Significance
- Once irrigated and added with humus, it gives a high yield because the mineral base is rich.
- It supports rice, sugarcane, cotton cultivation
- Millets and pulses are grown in drier areas
- Kaveri and Vaigai basins are famous for red alluvium and if irrigated well, are suitable for paddy
- Large regions of Karnataka and Kerala have developed Red soil regions for rubber and coffee plantation farming.
Laterite Soil
Formation
- This soil has emerged in those regions where the following conditions are fulfilled
- There must be laterite rock or structure (Laterites are rich in iron and aluminium content)
- Alternating dry and wet periods are more suitable for the development of laterite soils.
Characteristics
- Brown in colour
- composed essentially of a mixture of hydrated oxides of aluminium and iron.
- Iron oxides are found in nodules form
- Its rich in iron and aluminium but poor in Nitrogen, Phosphorous, Potash, Lime, and Magnesia
- Its humus and water-retaining capacities are moderate
- Bacterial activities have been very high and heavy precipitation develops leaching of humus as a result humus content is moderate to low.
Distribution
- Regions of laterite soil in the country are :
- It is found in patches in Western Ghats ( Goa and Maharashtra).
- In Belgam district of Karnataka and in laterite plateau of Kerala
- In the state of Orissa, in the Eastern Ghats,
- Amarkantak plateau region of MP-
- Panchmahal district of Gujarat;
- Santhal Pangana divisions of Jharkhand
Significance
- It is famous for crops like groundnut, cashew nut, etc.
- Laterite soil of Karnataka is given to coffee, rubber, and spices farming.
Forest Soil/ Mountain Soil
Formation – It is principally found on mountains with steeper slopes, high relief, shallow profiles.
Characteristics
- It is thin layered and the profiles and horizons are poorly developed
- Due to fast drainage, it has been vulnerable to soil erosion
- It is rich in organic content – humus content is also adequate but other nutrients aredeficient
- It is a loamy soil when sand, silt, and clay are in mixed form
Distribution
- These are generally found over 900m altitude
- Himalayas, Himalayan foothills, mountain slopes of Western Ghats, Nilgiri, Annamalai, and Cardamom hills
- Significance – It is very helpful to those crops which need favourable air and water drainage which is provided by this soil by virtue of being on slopes
- Generally used for rubber plantation, bamboo plantation and also tea, coffee, and fruits farming
- Large area also given to shifting agriculture where the soil fertility deteriorates after 2-3 years
- Due to less scope of agriculture, silvi pastoral farming (forest+grasses) can be sustained.
Desert Soil
- This soil is deposited by wind action and mainly found in the arid and semi-arid areas like Rajasthan, West of the Aravallis, Northern Gujarat, Saurashtra, Kachchh, Western parts of Haryana, and southern part of Punjab.
- It lacks in moisture content. Humus content is less, and Nitrogen is originally low but some of it is available in the form of nitrates.
- They are sandy with low organic matter. Living microorganisms are low in content
- It is rich in iron contents. Phosphorous content is nearly adequate, rich in lime and bases.
- It has low soluble salts and moisture with very low retaining capacity.
- If irrigated this soil gives a high agricultural return.
- These are suitable for less water-intensive crops like Bajra, pulses, fodder, and guar.
Distribution –western Rajasthan, Rann of Kachchh, in patches in south Haryana and south Punjab.
Saline and Alkaline Soil
- Alkali soil contains a large content of NaCl
- The soil is infertile
- These are also called Reh, Usar, Kallar, Rakar, Thur, and Chopan.
- These are mainly found in Rajasthan, Haryana, Punjab, Uttar Pradesh, Bihar, and Maharashtra.
- Sodium chloride and sodium sulphate are present in this soil. It is suitable for leguminous crops.
- Formation and distribution – It is both natural and anthropogenic
- Natural – Includes dried up lakes of Rajasthan and Rann of Kuchchh
- It has emerged in the Palaya basin ( a clay basin in the midst of the desert)
- Anthropogenic –It is developed in western UP and Punjab due to faulty agriculture.
- Natural – Includes dried up lakes of Rajasthan and Rann of Kuchchh
- Characteristics – Lack of moisture, humus, and living microorganisms, as a result, humus formation is almost absent
Peaty, and Marshy Soil/Bog Soil
This soil originates from the areas where adequate drainage is not possible. It is rich in organic matter and has high salinity. They are deficient in potash and phosphate.
- Characteristics – Dominance of clay and mud which make it heavy
- Rich in moisture content but at the same time, greater content of salt and every day inundation by high tide has made it infertile soil
- No organic activity due to excessive moisture content
- Distribution – It is characteristic of the delta region of India
- Besides the delta region, it is also found in
- Alleppey(Kerala) (known as Karri along the backwaters or Kayals of Kerala)
- Almora (Uttaranchal)
- Besides the delta region, it is also found in
- Significance – Over Bengal delta, it is suitable for jute and rice, and over Malabar, it is suitable for spices, rubber, big sized rice
- It has to some extent been favorable to the Mangrove forests of India.
Characteristics of Indian Soils
- Most soils are old and mature. Soils of the peninsular plateau are much older than the soils of the great northern plain.
- Indian soils are largely deficient in nitrogen, mineral salts, humus and other organic materials.
- Plains and valleys have thick layers of soils while hilly and plateau areas depict thin soil cover.
- Some soils like alluvial and black soils are fertile while some other soils such as laterite, desert and alkaline soils lack in fertility and do not yield good harvest.
- Indian soils have been used for cultivation for hundreds of years and have lost much of their fertility.
Problems of Indian Soils
- Soil erosion (Himalayan region, Chambal Ravines, etc.), deficiency in fertility (Red, lateritic, and other soils), desertification (around Thar desert, rain-shadow regions like parts of Karnataka, Telangana, etc.), waterlogging (Punjab-Haryana plain) salinity, and alkalinity (excessively irrigated regions of Punjab, Haryana, Karnataka, etc.), wasteland, overexploitation of soils due to increase in population and rise in living standards and encroachment of agricultural land due to urban and transport development.
Economy
Bihar Naman GS, Patna
BASIC CONCEPTS
- Macroeconomic Concepts
- Meaning of Economics
- Types of Economies
- Sectors of an Economy
- Other Sectors of Economy
- Microeconomic Concepts
ECONOMIC MEASUREMENTS
- National Income Concepts and Methods of Calculation
- National Income
- Real National Income
- Calculating National Income
- Gross Fixed Capital Formation (GFCF)
- National Organizations Related to National Income Accounts
- Latest India’s National Income Estimates
- New Series of National Statistics (Base Year 2011-12)
- Annual Estimates of Expenditures on GDP
- Per Capita Income
- Purchasing Power Parity
- Lorenz Curve
- Philip’s Curve
- Gini Coefficient
- Inflation
- Concepts and Types of Inflation
- Causes of Inflation
- Effects of Inflation
- Measures of Inflation
- WPI, CPI
- Producer Price Index
- GDP Deflator
- Core Inflation
- Change in Reporting of Inflation
- Measures to Check Inflation??
- Fiscal Measures
- Administrative Measures
- Monentary Measures
- Economic Growth and Development
- Economic Growth
- Economic Development
- Measurement of Economic Development
- Physical Quality of Life Index (PQLI)
- Millennium Development Goals (MDGs)
- Different Levels of Economic Development
- Economy and Environment?
- Environment Taxes
- Carbon Tax
- Green Accounting
- 12th Five Year Plan and Sustainability
MONEY AND BANKING
- Money Function and Classification
- Money Concept
- Measures of Money Supply in India
- Indian currency system
- Broad and Narrow Money
- Money multiplier
- Digital Money
- New Monetary Aggregates
- Monetary Policy
- Financial Market and its Instruments
- Concept and functions of financial markets
- Importance of money market
- Types of capital market
- Distinguish between capital market and money market
- Nature and functions of a stock exchange
- Advantages of stock exchanges
- Limitations of stock exchanges
- The stock exchanges in India
- Insurance Industry - Insurance Industry and Reforms
- Role of Financial Regulators: SEBI and IRDA
- Banking Structure in India
- Scheduled Commercial Banks
- Nationalized Banks
- Public Sector Banks
- State Bank of India
- Private Banks
- Foreign Banks
- Regional Rural Banks
- Scheduled Co-operative Banks
- Reserve Bank of India (RBI)
- Methods of Credit Control
- Cash Reserve Ratio (CRR)
- Statutory Liquidity Ratio (SLR)
- Repo Rate
- Reserve Repo Rate
- Call Rates
- Marginal Standing Facility (MSF)
- Bank Rate
- Banking Sector Reforms in India
- Differentiated Banks
- Payment Banks
- Small Banks
- New banking license
- White Label ATM
- Unified Payments Interface
- Bank Board Bureau
- Marginal Cost of Funds Based Lending Rate (MCLR)
- Priority Sector Lending Certificates
- Concept of Micro ATM
- Banking Reforms
- Basel Norms
- Banking Ombudsman
- Development Financial Institutions
- Insurance Companies
- Recent developments in Economic Sector
- Government to recapitalize the PSB’s
- RBI rule and regulation for peer to peer (P2P) lending
- Domestic Systematically Important Banks (SIBs) of India
- Financial Inclusion in India
- The Concept of Bad Bank
- Alternative Mechanism Panel for PSB consolidation
- Employee Provident Fund of India
- Enforcement Department In RBI
- Gold Monetization Scheme (GMS)
- Indian Post Payment Bank (IPPB)
- Indian Gold Coins/Gold Bullion Scheme
PUBLIC FINANCE IN INDIA
- Budgeting
- Union Budget
- Plan and Non Plan Expenditure
- Revenue Receipts
- Tax Revenue Receipts
- Non-Tax Revenue Receipts
- Fiscal Policy
- Fiscal Responsibility and Budget Management (FRBM) Act, 2003
- Revenue Deficit, Fiscal Deficit, Primary Deficit
- Deficit and Surplus Budget
- Deficit Financing
- Centre State Distribution
- Finance Commission (A280)
- Tax Structure in India
- Tax – Direct Tax, Indirect Tax
- Methods of Taxation – Progressive,
Regressive, Proportional - Value Added Tax – VAT in India
- Goods and Services Tax – GST, GST Council
- Service Tax
- DTC – Direct Tax Code
PLANNING
- Meaning Objectives and History
- Meaning of Economic Planning
- Objectives of Planning
- Strategies of Planning
- Harrod Domar strategy
- Nehru Mahalonobis strategy
- Gandhian strategy
- LPG strategy
- Regional and National Planning
- Imperative and Indicative Planning
- History of Planning in India
- Visvesvaraya Plan, Gandhian Plan FICCI Proposal, Congress Plan Bombay Plan
- Planning Commission and National Development Council(NDC)
- Central Planning – 5 Year Plans, 20 Point Program, MPLADS
- Decentralized Planning
- Planning Institutions
- Planning Commission
- NITI Aayog
- National Development Council (NDC)
- Five Year Plans in India
- 12th Five Year Plan (2012-2017)
- Alternative Scenarios During 12th Plan
- Economic Reforms
OPEN ECONOMY
- Foreign Trade Concepts
- Balance of Payments
- Foreign Capital – FDI, FPI, FII, QFH
- Foreign Exchange–Exchange Rate NEER & REER, ETF
- FERA & FEMA
- Capital Account Convertibility in India
- India's External Debt
- NRI Deposits
- Trade Composition
- Trade Policy and Agreements
- Import Cover
- Import/Export Controls
- Foreign Trade policy 2015-20
- Export Promotion
- General Agreement on Tariffs and Trade
- Exchange Rate
- Exchange Market
- LERMS
- NEER
- REER
- ETF
- International Organization
- United Nations
- Food and Agriculture Organization (FAO)
- International Civil Aviation Organization (ICAO)
- International Fund for Agricultural Development (IFAD)
- International Labour Organization (ILO)
- International Maritime Organization (IMO)
- International Monetary Fund (IMF)
- International Telecommunication Union (ITU)
- United Nations Educational, Scientific and Cultural Organization (UNESCO)
- United Nations Industrial Development Organization (UNIDO)
- Universal Postal Union (UPU)
- World Bank Group (WBG)
- International Bank for Reconstruction and Development (IBRD)
- International Finance Corporation (IFC)
- International Development Association (IDA)
- World Health Organization (WHO)
- World Intellectual Property Organization (WIPO)
- World Meteorological Organization (WMO)
- World Tourism Organization (UNWTO)
- World Trade Organization (WTO)
- Asian Development Bank
- Asian Infrastructure Investment Bank (AII)
- New Development Bank
- African Development Bank
- Trade Agreements
- RCEP
- TPP
- NAFTA
- MERCOSUR
- Southern African Development Community (SADC)
- ASEAN
- SAFTA
- Recent Developments in External Sector
- Global foreign exchange committee
- Price capping of medical devices in India
- Review of the International Investment Agreement (IIA)
- India signed the OECD multilateral convention to prevent BEPS (Base Erosion and Profit Shifting)
- Second Exchange Traded Fund (ETF) Bharat 22
- Double Tax Avoidance Treaty
- Preferential Trade Agreement with Chile
- Advance Pricing Agreement
- National Committee on Trade Facilitation
- E-tourist Visa
- India’s Asylum Policy
- Investor-State Dispute Settlement (ISDS)
ECONOMIC SECTORS
- Poverty
- Definition and Indices
- Poverty in India
- Human Poverty Index (HPI)
- Expert Groups for Estimating Poverty
- Inequality
- Employment
- Employment and Unemployment
- Poverty Eradication and Employment Related Related programs
- Government Schemes and Programs
- New Social Welfare Schemes
- Pradhan Mantri Jeevan Jyoti Bima Yojana (PMJJBY)
- Other Social Protection Programmes
- Rural Infrastructure and Development
- Urban Infrastructure, Housing and Sanitation
- Education Schemes
- Financial Inclusion Schemes
- Health Schemes
- Women Empowerment Programmes
- Other Women Empowerment Programmes
- Social Security
- Committees
- Ratan P Watal Committee on Digital Payment
- Committee for Market Infrastructure Institution (MII)
- P. J. Nayak Committee
- Deepak Mohanty Committee Report on Medium-term Path on Financial Inclusion
- Narasimham Committee Report on Banking Sector Reforms
- Uday Kotak Committee on Corporate Governance
- Nachiket Mor Committee
- Others Committee